US Crude Balance — May 2026
Generated 2026-08-13 20:43 UTC. All flows MBBL/D. Bottom-up balance vs EIA published data.
Source freshness
| source | latest_period | lag_months | last_pulled | expected_cadence | expected_next | status |
|---|---|---|---|---|---|---|
| AER | 2026-05-01 | 3 | 2026-07-30 02:42 | monthly | 2026-06-01 | OK |
| CER | 2026-06-16 | 2 | 2026-07-30 02:42 | monthly | 2026-07-16 | OK |
| CER_TOLLS | 2026-05-01 | 3 | 2026-07-30 02:41 | monthly | 2026-06-01 | OK |
| CNLOPB | 2026-06-01 | 2 | 2026-07-30 02:45 | monthly | 2026-07-01 | OK |
| EIA | 2026-05-01 | 3 | 2026-08-13 01:28 | monthly | 2026-06-01 | OK |
| EIA_WEEKLY | 2026-07-24 | 1 | 2026-07-30 02:39 | weekly | 2026-07-31 | OK |
| FERC | 2026-04-01 | 4 | 2026-08-07 05:26 | annual | 2027-04-01 | OK |
| NDIC | 2026-05-01 | 3 | 2026-07-30 02:47 | monthly | 2026-06-01 | OK |
| NM_OCD | 2026-05-01 | 3 | 2026-08-03 18:05 | monthly | 2026-06-01 | OK |
| PORTOFCC | 2026-05-01 | 3 | 2026-07-30 02:47 | monthly | 2026-06-01 | OK |
| RRC | 2026-08-01 | 0 | 2026-07-30 02:46 | monthly | 2026-09-01 | OK |
| RRC_COMPLETIONS | 2026-07-01 | 1 | 2026-07-30 20:20 | monthly | 2026-08-01 | OK |
| RRC_DRILLING_PERMITS | 2026-07-01 | 1 | 2026-07-30 20:15 | monthly | 2026-08-01 | OK |
| RRC_PDQ | 2026-08-01 | 0 | 2026-07-30 18:32 | monthly | 2026-09-01 | OK |
| RRC_PENDING_LEASE | 2026-05-01 | 3 | 2026-07-17 18:00 | monthly | 2026-06-01 | OK |
| RRC_T1 | 2025-12-01 | 8 | 2026-08-13 19:58 | monthly | 2026-01-01 | OK |
| SASK_ENERGY | 2026-05-01 | 3 | 2026-07-30 02:44 | monthly | 2026-06-01 | OK |
| STATCAN | 2026-04-01 | 4 | 2026-07-30 02:42 | monthly | 2026-05-01 | LATE |
Headlines
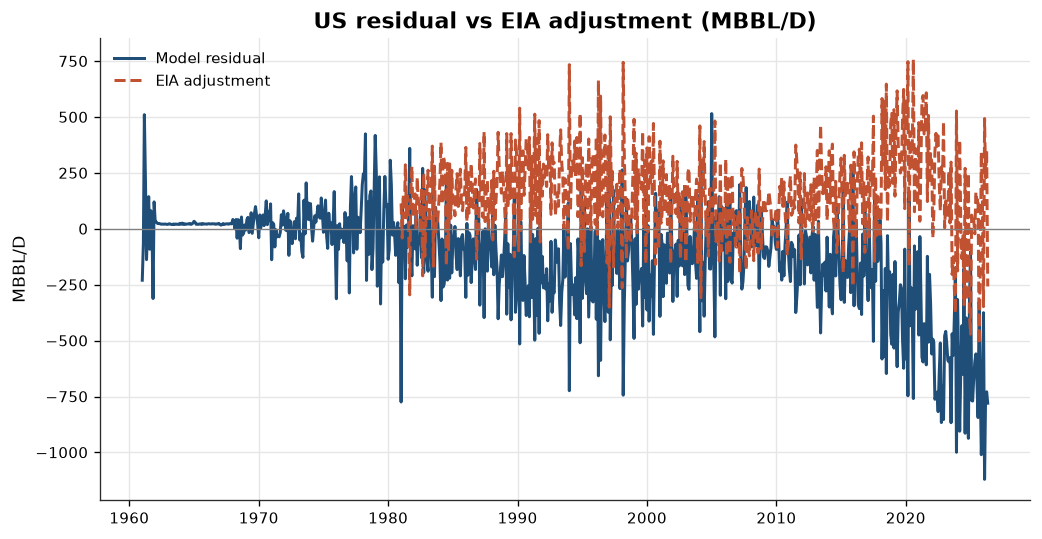
- US residual: -780 MBBL/D.
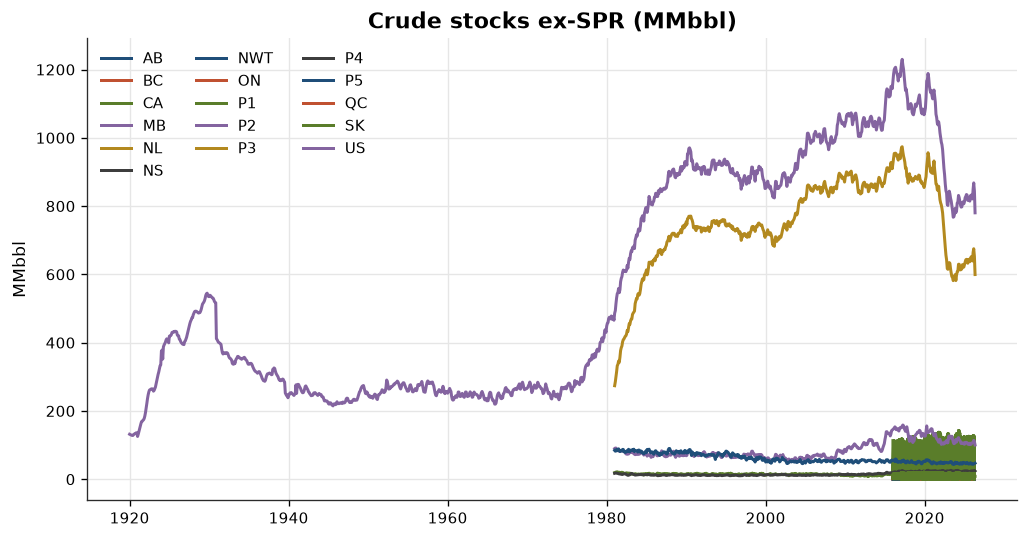
- Stock Draw up 1,283 MBBL/D m/m.
- Refinery Inputs up 642 MBBL/D m/m.
- Imports down 304 MBBL/D m/m.
Balance by region
| Region | production | imports | net_receipts | stock_draw | refinery_inputs | exports | exports_basis | residual | spr_stock_draw | residual_incl_spr | transfers_to_supply | residual_incl_transfers | national_terms | residual_incl_national_terms |
|---|---|---|---|---|---|---|---|---|---|---|---|---|---|---|
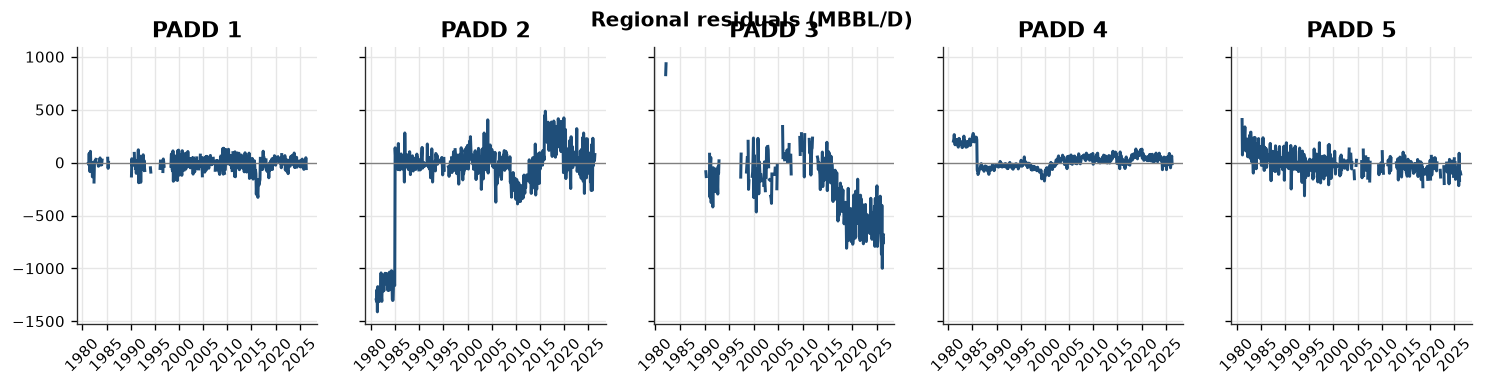
| US | 13,714 | 5,953 | 0 | 2,068 | 16,787 | 5,728 | REPORTED | -780 | 1,263 | 483 | 1,037 | 257 | nan | nan |
| P1 | 55 | 487 | 213 | 4 | 804 | 11 | REPORTED | -56 | nan | nan | nan | -56 | nan | nan |
| P2 | 1,757 | 2,816 | -794 | 322 | 3,982 | 42 | REPORTED | 76 | nan | nan | nan | 76 | nan | nan |
| P3 | 10,201 | 1,279 | 1,270 | 1,726 | 9,556 | 5,604 | REPORTED | -684 | nan | nan | nan | -684 | 779 | 95 |
| P4 | 1,009 | 355 | -862 | 58 | 569 | 0 | CLOSURE | -10 | nan | nan | nan | -10 | nan | nan |
| P5 | 692 | 1,016 | 174 | -41 | 1,877 | 72 | REPORTED | -108 | nan | nan | nan | -108 | nan | nan |
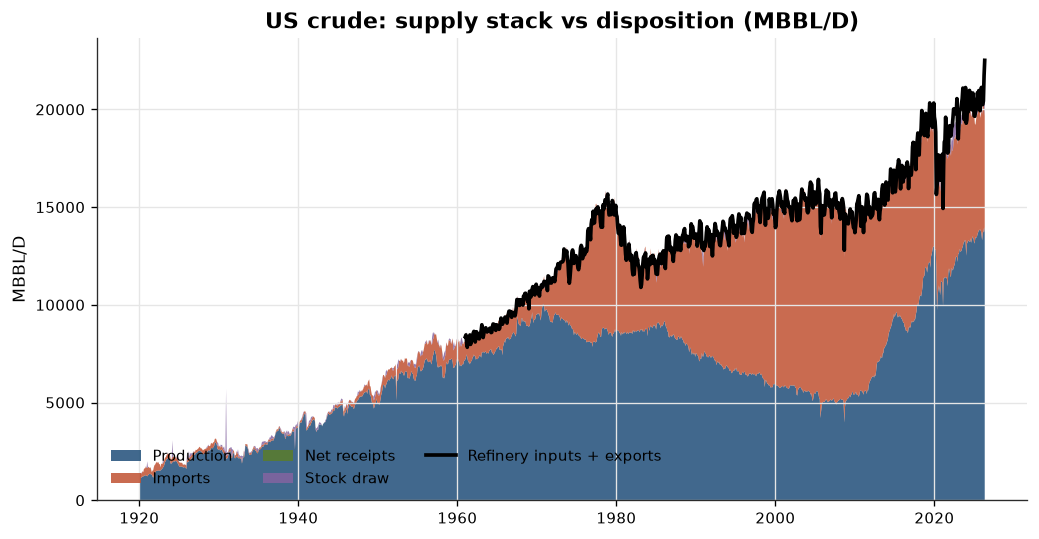
Residual reconciliation vs EIA adjustment (last 12 months)
| period | model_residual | spr_stock_draw | residual_incl_spr | transfers_to_supply | residual_incl_transfers | eia_adjustment | gap | gap_incl_spr | gap_incl_transfers |
|---|---|---|---|---|---|---|---|---|---|
| 2025-06 | -559 | -31 | -591 | 395 | -164 | 165 | -395 | -426 | 0 |
| 2025-07 | -687 | 1 | -686 | 569 | -118 | 116 | -570 | -569 | -1 |
| 2025-08 | -844 | -63 | -907 | 706 | -138 | 138 | -706 | -769 | 0 |
| 2025-09 | -326 | -68 | -394 | 840 | 514 | -514 | -840 | -908 | 0 |
| 2025-10 | -684 | -84 | -768 | 890 | 206 | -205 | -889 | -973 | 1 |
| 2025-11 | -1,010 | -78 | -1,088 | 666 | -344 | 343 | -667 | -745 | -1 |
| 2025-12 | -813 | -50 | -863 | 671 | -142 | 142 | -671 | -720 | 0 |
| 2026-01 | -375 | -56 | -431 | 723 | 348 | -348 | -723 | -780 | -0 |
| 2026-02 | -1,120 | -8 | -1,129 | 628 | -492 | 493 | -627 | -635 | 1 |
| 2026-03 | -754 | 20 | -735 | 527 | -227 | 228 | -526 | -506 | 1 |
| 2026-04 | -729 | 677 | -52 | 379 | -350 | 350 | -379 | 298 | 0 |
| 2026-05 | -780 | 1,263 | 483 | 1,037 | 257 | -258 | -1,037 | 225 | -0 |
Regional residuals
Stocks
Data vintage: AER: 2026-07-30 02:42 UTC; CER: 2026-07-30 02:42 UTC; CNLOPB: 2026-07-30 02:45 UTC; EIA: 2026-08-12 18:40 UTC; EIA_WEEKLY: 2026-07-30 02:39 UTC; FERC: 2026-08-07 05:26 UTC; NDIC: 2026-07-30 02:47 UTC; NM_OCD: 2026-08-03 18:05 UTC; PORTOFCC: 2026-07-30 02:47 UTC; RRC: 2026-07-30 02:46 UTC; RRC_COMPLETIONS: 2026-07-30 20:20 UTC; RRC_DRILLING_PERMITS: 2026-07-30 20:15 UTC; RRC_PDQ: 2026-07-30 18:32 UTC; RRC_PENDING_LEASE: 2026-07-17 18:00 UTC; RRC_T1: 2026-08-13 19:58 UTC; SASK_ENERGY: 2026-07-30 02:44 UTC; STATCAN: 2026-07-30 02:42 UTC